Share of the top Posts
The share of all impressions that the top 1, 5 and 10% of Posts earned.
SAMPLEReport· 3,500 Posts · created 14 Nov 2026, 18:57 UTC
#ThanksGiving4 Nov 2026 → 14 Nov 2026 UTC
Real impressions
482,723
How many times X showed the Posts, as X counts it for each Post.
Real reach against potential
4.4%
The real impressions against the followers of all the Authors.
Efficiency per account
12,748
@fearqueerhorror, the top Author. The Authors with at least 2 Posts that earned the most impressions per Post.
Posts per day (UTC)
How much was posted, by how many Authors, and how often it was seen.
Posts
3,500
The number of Posts that the Query collected.
Authors
2,033
The number of different accounts that published them.
Real impressions
482,723
How many times X showed the Posts, as X counts it for each Post.
Likes
11,367
The likes of all the Posts, added together.
Reposts
2,527
The Reposts of all the Posts, added together.
Replies
1,387
The Replies that the Posts received, added together.
Engagement
15,281
Likes, Reposts and Replies together.
Potential reach
11,066,600
The followers of all the Authors, each Author counted once.
Period
4 Nov 2026 → 14 Nov 2026
The time of the first and of the last Post.
Two raw figures against each other, so that this conversation compares with others.
Impressions per Post
138
How often an average Post was seen.
Impressions per Author
237
How often the Posts of an average Author were seen.
Posts per Author
1.72
How many Posts an average Author published.
Engagement per Post
4.37
How many likes, Reposts and Replies an average Post received.
Engagement rate
3.2%
The share of impressions that turned into a like, a Repost or a Reply.
Amplification
0.72
How many Reposts an average Post received.
Conversation
0.40
How many Replies an average Post received.
Real reach against potential
4.4%
The real impressions against the followers of all the Authors.
How much of the impressions a few Posts and a few Authors carry.
The share of all impressions that the top 1, 5 and 10% of Posts earned.
The share of all impressions that the top 1, 5 and 10% of Authors earned.
How few Authors, from the top, earned half of all impressions.
27of 2,033 Authors earned half of all impressions
The Posts that carried the conversation, the top 10 by each figure.
Impressions. The Posts that X showed most often.
Henry and Logan kissing each other #yaga #hudsonwilliams #gay #horror #sex #hot #retweet #witch #thanksgiving #halloween #heatedrivalry x.com/fearqueerhorror/status/2118622758590439591/video/1
he enjoys nutting on my mouth #fyp #NoNutNovember #watta #Content #615meetups #thick #chudaiㅤ #Thanksgiving x.com/Widemouthkaya/status/2120383055991067034/video/1
Roblox has released 3 items with effects. 1 being emissive 2 being smoke particle. Everlastin’ Jack-O-Lantern - roblox.com/catalog/100941878599067/Everlastin-Jack-O-Lantern of Cozy - roblox.com/Earcatalog/92849137408622/Cup-of-Cozy Drumsticks - roblox.com/catalog/133224540588474/Ear-Drumsticks#ROBLOX #Christmas #Halloween #Thanksgiving x.com/obscurezab/status/2118456340804989166/photo/1

New Video Released: Stuart Not-So-Little 2: Meet the Grandparents!One year has passed and Thanksgiving is here again!This year Stuart's grandparents are joining the family for Thanksgiving dinner!#muscle #musclegrowth #thanksgiving x.com/MGKorgi/status/2121271881257173070/video/1
New Video: Stuart Not-So-LittleA young man named Stuart heads off to college only to return home for Thanksgiving a changed man!#muscle #musclegrowth #thanksgiving x.com/MGKorgi/status/2118200518346756322/video/1
K-Shine Really Made A Thanksgiving Anthem For The Culture! 😂🔥#battlerap #rapbattle #rap #funny #thanksgiving x.com/ImDreDennis/status/2120516026249191647/video/1
😃 #ThursdayVibes 🤎 Good Thursday 🌅 #ThursdayMorning #ThursdayMotivation Happy Friday Eve #ThursdayThoughts #MorningVibes #ThankfulThursday🍁🍂 🦃🍽🥧🏈🍄Countdown to Thanksgiving➡️ Today: (November 05) #Thanksgiving in 3⃣-Weeks 🍁🧡🍗🏵️☕🥨🍂🦃 x.com/akama_kenneth/status/2118329476664922460/photo/1
NOTHING is to provoke anxiety and EVERYTHING is to be brought to God in prayer!#prayer #christian #thanksgiving #donmoen x.com/donmoen/status/2119059292720365829/video/1
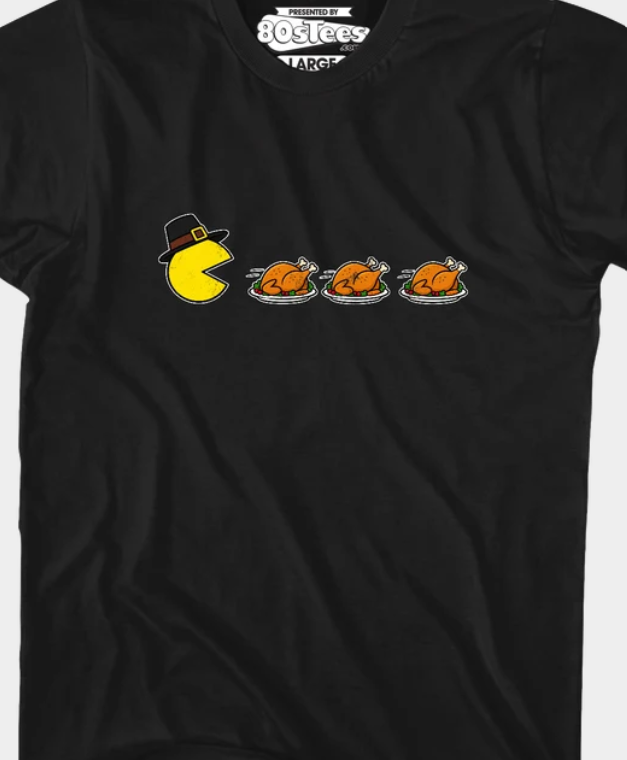
Our choice for Old School #80s T-Shirt of the Week > 80stees.com/products/pac-pilgrim-t-shirt - #Thanksgiving Pac-Pilgrim - use discount code: oldschool80s to SAVE an extra 10% OFF of this or ANY other shirt at the awesome @80stees site! x.com/OldSchool80s/status/2119227149047533650/photo/1
I had green bean casserole for the first time ever and I have some thoughts. Y'all hyped this up for years. Is green bean casserole a holiday must or totally overrated? #greenbeancasserole #thanksgiving #holidayfood #foodreview #foodie x.com/S_johnson_voice/status/2121620240668754360/video/1
Likes. The Posts with the most likes.
he enjoys nutting on my mouth #fyp #NoNutNovember #watta #Content #615meetups #thick #chudaiㅤ #Thanksgiving x.com/Widemouthkaya/status/2120383055991067034/video/1
We started the Reed Squad Food Drive today! The goal is to feed 5-10 families by Thanksgiving! #givingback #thanksgiving #journey x.com/thatdudereed_/status/2120280918589870330/photo/1

NOTHING is to provoke anxiety and EVERYTHING is to be brought to God in prayer!#prayer #christian #thanksgiving #donmoen x.com/donmoen/status/2119059292720365829/video/1
New Video: Stuart Not-So-LittleA young man named Stuart heads off to college only to return home for Thanksgiving a changed man!#muscle #musclegrowth #thanksgiving x.com/MGKorgi/status/2118200518346756322/video/1
Y ¿dónde está el pavo?El pavo está en La Moneda#Thanksgiving x.com/Hugo_Gutierrez_/status/2120157135132598750/video/1
Just think about how gross this is… 🤢#thanksgiving x.com/PETAUK/status/2119725288531632604/photo/1
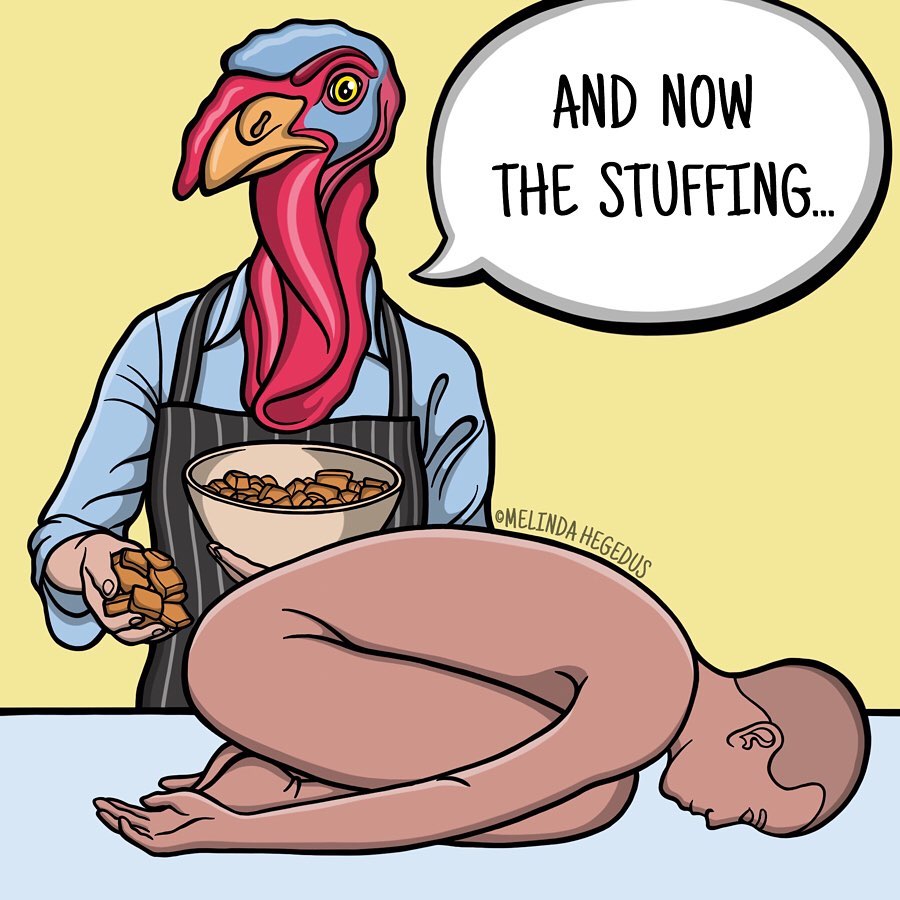
Roblox has released 3 items with effects. 1 being emissive 2 being smoke particle. Everlastin’ Jack-O-Lantern - roblox.com/catalog/100941878599067/Everlastin-Jack-O-Lantern of Cozy - roblox.com/Earcatalog/92849137408622/Cup-of-Cozy Drumsticks - roblox.com/catalog/133224540588474/Ear-Drumsticks#ROBLOX #Christmas #Halloween #Thanksgiving x.com/obscurezab/status/2118456340804989166/photo/1
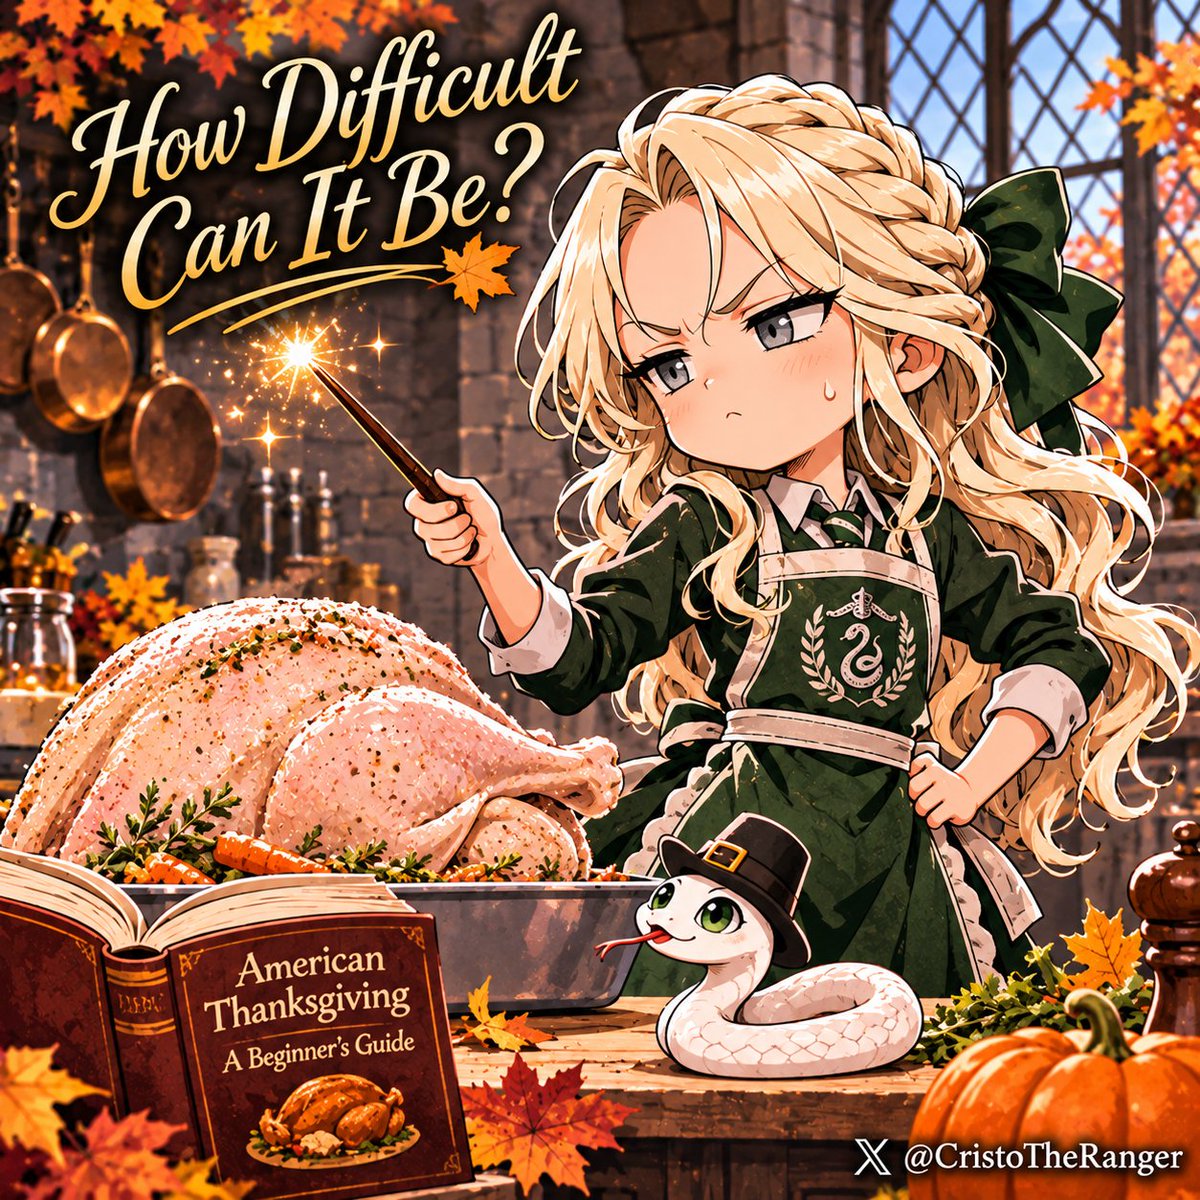
When Dracaena learned about the American Thanksgiving she thought it wouldn't be difficult. The problem is that her cookbook didn't teach her the secret art of the fried turkey.#HarryPotter #Dracaena #Malfoid #Yearn #Thanksgiving x.com/CristoTheRanger/status/2121208818906333471/photo/1
New Video Released: Stuart Not-So-Little 2: Meet the Grandparents!One year has passed and Thanksgiving is here again!This year Stuart's grandparents are joining the family for Thanksgiving dinner!#muscle #musclegrowth #thanksgiving x.com/MGKorgi/status/2121271881257173070/video/1
K-Shine Really Made A Thanksgiving Anthem For The Culture! 😂🔥#battlerap #rapbattle #rap #funny #thanksgiving x.com/ImDreDennis/status/2120516026249191647/video/1
Reposts. The Posts with the most Reposts.
Y ¿dónde está el pavo?El pavo está en La Moneda#Thanksgiving x.com/Hugo_Gutierrez_/status/2120157135132598750/video/1
🧡Season of Thanks Giveaway 🎁 Win a Coach Bag Owala Bottle Wearlizer Band & 2 × $15 Amazon Gift Cards!How to Enter:① Follow @Wearlizer② Like & share this post ③ Comment “Thankful & blessed!” below! 📅 Nov 8–28 | 🏆 Winners: Nov 30#Wearlizer #Giveaway #Thanksgiving x.com/Wearlizer/status/2119490137021149356/photo/1

he enjoys nutting on my mouth #fyp #NoNutNovember #watta #Content #615meetups #thick #chudaiㅤ #Thanksgiving x.com/Widemouthkaya/status/2120383055991067034/video/1
NOTHING is to provoke anxiety and EVERYTHING is to be brought to God in prayer!#prayer #christian #thanksgiving #donmoen x.com/donmoen/status/2119059292720365829/video/1
Just think about how gross this is… 🤢#thanksgiving x.com/PETAUK/status/2119725288531632604/photo/1
K-Shine Really Made A Thanksgiving Anthem For The Culture! 😂🔥#battlerap #rapbattle #rap #funny #thanksgiving x.com/ImDreDennis/status/2120516026249191647/video/1
When Dracaena learned about the American Thanksgiving she thought it wouldn't be difficult. The problem is that her cookbook didn't teach her the secret art of the fried turkey.#HarryPotter #Dracaena #Malfoid #Yearn #Thanksgiving x.com/CristoTheRanger/status/2121208818906333471/photo/1
Check out this new digital art that I uploaded to fineartamerica.com/featured/thanksgiving-floral-arrangement-eddie-eastwood.html #Thanksgiving #Roses #GreetingCards #WallArtForSale #Google x.com/PhotosbyEddie/status/2120249219814703206/photo/1

Check out this new digital art that I uploaded to fineartamerica.com/featured/thanksgiving-wishes-with-deer-and-pumpkins-eddie-eastwood.html #Thanksgiving #Greetingcards #Pumpkins #Fawn #Deer #Google x.com/PhotosbyEddie/status/2121322501670339029/photo/1

Cozy Coffee Mugs for Dog Moms Ceramic Mug Black/White. Amazon Prime➡️ a.co/d/01ZJpkpb ☕️🐶 #Thanksgiving #fall #dogmom #giftideas #Amazon via @Amazon
Replies. The Posts with the most Replies.
🧡Season of Thanks Giveaway 🎁 Win a Coach Bag Owala Bottle Wearlizer Band & 2 × $15 Amazon Gift Cards!How to Enter:① Follow @Wearlizer② Like & share this post ③ Comment “Thankful & blessed!” below! 📅 Nov 8–28 | 🏆 Winners: Nov 30#Wearlizer #Giveaway #Thanksgiving x.com/Wearlizer/status/2119490137021149356/photo/1
Just two days left! 🦃🍂Thanksgiving Riches: Hold and Win is almost here. Are you ready? 👀Coming November 12! 🎮#ONLYPLAY #Onlyplayclub #Thanksgiving x.com/onlyplayclub/status/2120062457708155020/photo/1

Which Thanksgiving pie deserves the last slice—and which one are you politely pretending to like? 🥧🍂 Cast your vote! #Thanksgiving #PieDay #HappyThanksgiving x.com/HappyMotorhead/status/2119992189648511172/photo/1

What's everyone's thoughts on Prime Rib for Thanksgiving? Or are you doing the traditional Turkey?@SQ1Wellness #meatheals #thanksgiving x.com/Square1Wellness/status/2120301918929232381/photo/1

Thanksgiving is only 2 weeks away 🦃 What's the ONE dish you gotta have on that table or it don't even feel like Thanksgiving ? #Thanksgiving #BlockChainBizz
Morning peeps 👋🏽 2 weeks to Thanksgiving 🤎 🍁 🍂 🧡I got a kick out of this one 😆 Hope it makes someone laugh 😂 It’s good for the soul 😝 #Thanksgiving#jokes x.com/MelC930/status/2120885811873013841/photo/1

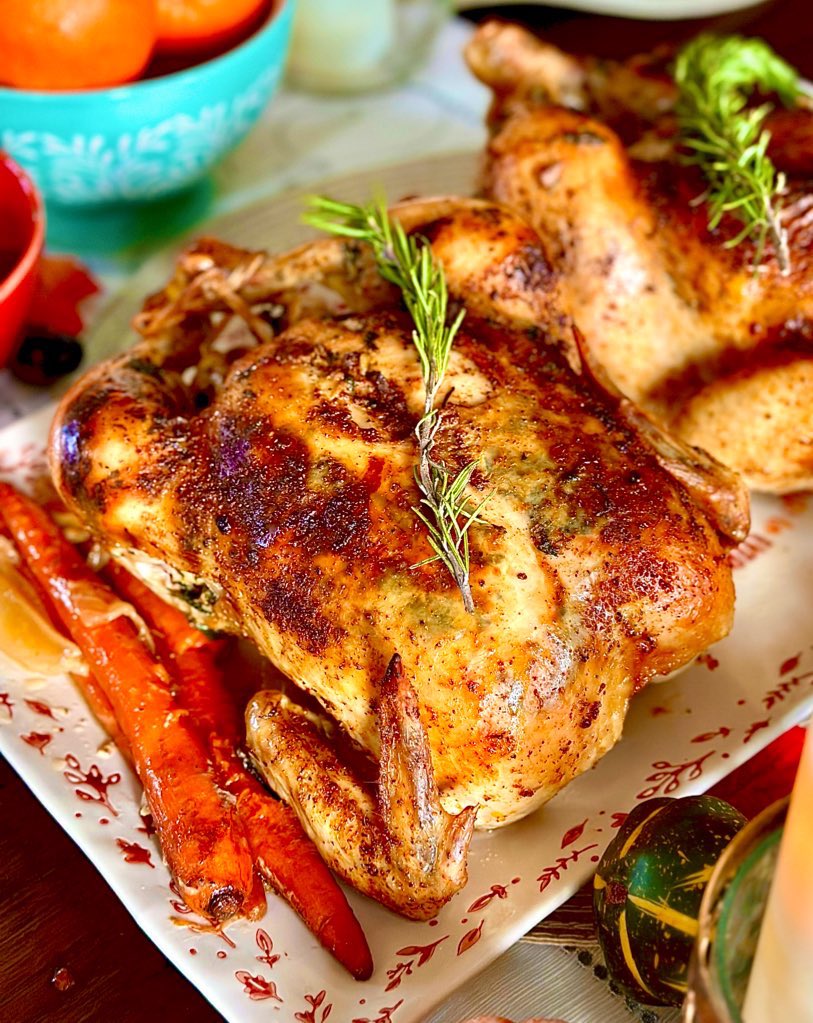
Cajun spice roasted chicken using @DadsSeasonings for my Thanksgiving table last year! Succulent spicy and so flavorful. 🦃🔥👌🏻#Thanksgiving #holidays x.com/sonisfood/status/2120491986750681098/photo/1 twitter.com/sonisfood/status/2113268898254434311
Quoted Post by @sonisfood
View quoted Post on XThis month we will do a weird #Thanksgiving photo everyday On a scale of 1/10 how weird? x.com/HorrorNHaunted/status/2119211811526382045/photo/1

This month we will do a weird #Thanksgiving photo everyday On a scale of 1/10 how weird? x.com/HorrorNHaunted/status/2120886352786915573/photo/1

BUYS ONLY.......NO NOISE PLEASE q8gxXxDi4NK6W4NAJkNjwn52DBUgFkK9MazVDMHpumpdexscreener.com/solana/6YVzUt5S7U2Uf91FJjJffXdwPLdSJuoYv41spWgG8xkh#solanamemecoin #cryptoalpha #pumpfun #thanksgiving #xmas #1000x #fomo x.com/merrycat_celeb/status/2119166258738307561/video/1
Engagement. The Posts with the most likes, Reposts and Replies together.
he enjoys nutting on my mouth #fyp #NoNutNovember #watta #Content #615meetups #thick #chudaiㅤ #Thanksgiving x.com/Widemouthkaya/status/2120383055991067034/video/1
NOTHING is to provoke anxiety and EVERYTHING is to be brought to God in prayer!#prayer #christian #thanksgiving #donmoen x.com/donmoen/status/2119059292720365829/video/1
We started the Reed Squad Food Drive today! The goal is to feed 5-10 families by Thanksgiving! #givingback #thanksgiving #journey x.com/thatdudereed_/status/2120280918589870330/photo/1
New Video: Stuart Not-So-LittleA young man named Stuart heads off to college only to return home for Thanksgiving a changed man!#muscle #musclegrowth #thanksgiving x.com/MGKorgi/status/2118200518346756322/video/1
🧡Season of Thanks Giveaway 🎁 Win a Coach Bag Owala Bottle Wearlizer Band & 2 × $15 Amazon Gift Cards!How to Enter:① Follow @Wearlizer② Like & share this post ③ Comment “Thankful & blessed!” below! 📅 Nov 8–28 | 🏆 Winners: Nov 30#Wearlizer #Giveaway #Thanksgiving x.com/Wearlizer/status/2119490137021149356/photo/1
Y ¿dónde está el pavo?El pavo está en La Moneda#Thanksgiving x.com/Hugo_Gutierrez_/status/2120157135132598750/video/1
Just think about how gross this is… 🤢#thanksgiving x.com/PETAUK/status/2119725288531632604/photo/1
When Dracaena learned about the American Thanksgiving she thought it wouldn't be difficult. The problem is that her cookbook didn't teach her the secret art of the fried turkey.#HarryPotter #Dracaena #Malfoid #Yearn #Thanksgiving x.com/CristoTheRanger/status/2121208818906333471/photo/1
Roblox has released 3 items with effects. 1 being emissive 2 being smoke particle. Everlastin’ Jack-O-Lantern - roblox.com/catalog/100941878599067/Everlastin-Jack-O-Lantern of Cozy - roblox.com/Earcatalog/92849137408622/Cup-of-Cozy Drumsticks - roblox.com/catalog/133224540588474/Ear-Drumsticks#ROBLOX #Christmas #Halloween #Thanksgiving x.com/obscurezab/status/2118456340804989166/photo/1
K-Shine Really Made A Thanksgiving Anthem For The Culture! 😂🔥#battlerap #rapbattle #rap #funny #thanksgiving x.com/ImDreDennis/status/2120516026249191647/video/1
Engagement rate. The Posts with at least the median impressions that turned the largest share of them into engagement.
Check out this new digital art that I uploaded to fineartamerica.com/featured/thanksgiving-wishes-with-deer-and-pumpkins-eddie-eastwood.html #Thanksgiving #Greetingcards #Pumpkins #Fawn #Deer #Google x.com/PhotosbyEddie/status/2121322501670339029/photo/1
unicorncraftyshop.etsy.com/listing/4598893510/acorn-and-pumpkin-zipper-pulls-set-of-2#etsyfinds #etsygifts #acorn #pumpkin #Fall #Thanksgiving #zipperpulls #FridayMotivation #friyay
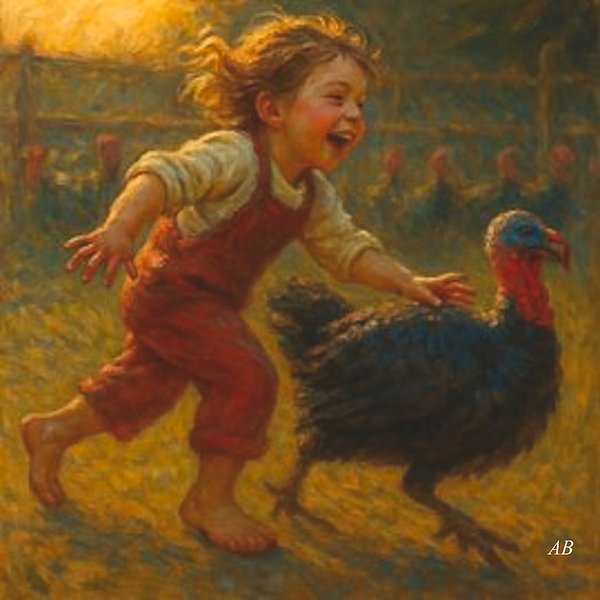
#SOLD MY #ARTWORK THANKS TO THE BUYER IN MA. #THANKSGIVING #TURKEY #CHASE GREETING #CARD. #sellingonline #art #prints #featured #guarantee. Also on #Pixels. By #Arlene #Babad. fineartamerica.com/featured/thanksgiving-turkey-chase-arlene-babad.html x.com/artbybabad/status/2121031433225376165/photo/1
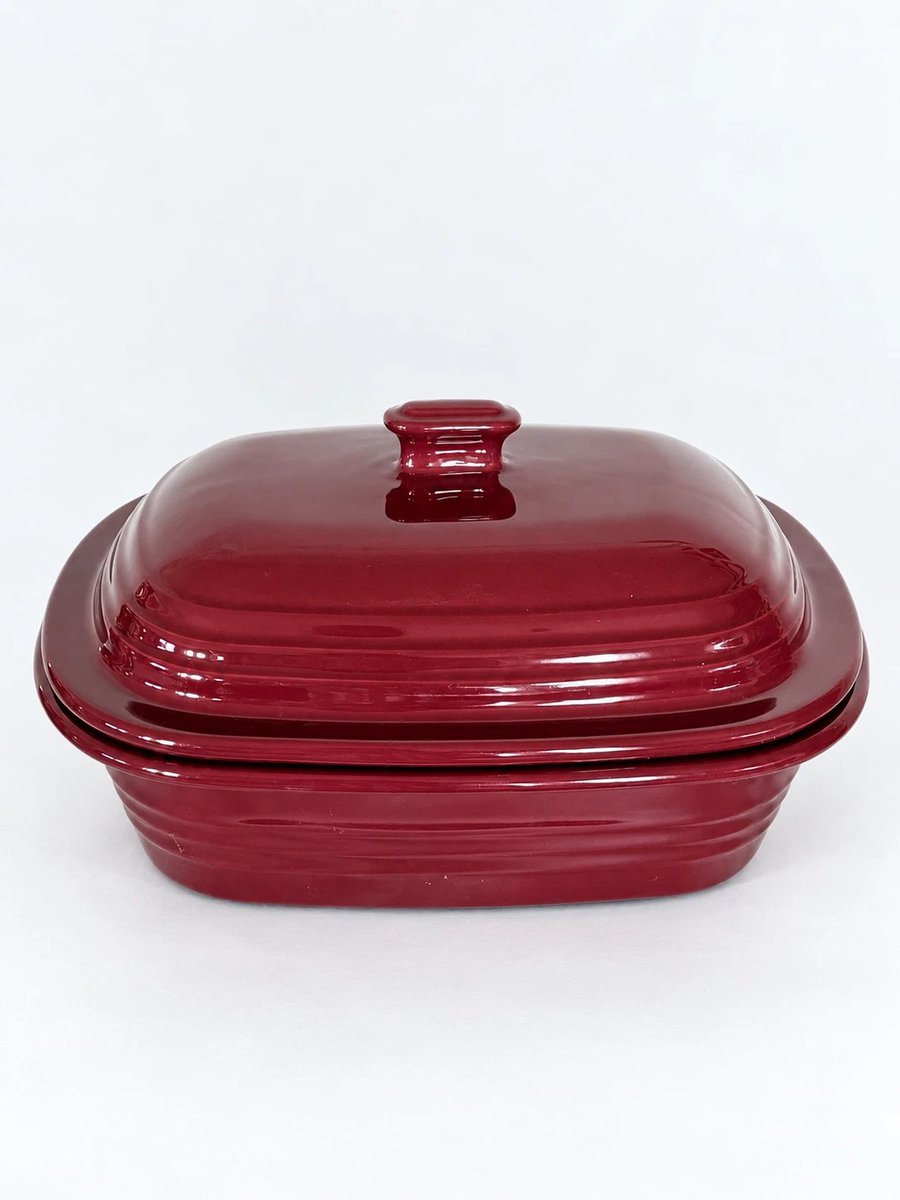
Pampered Chef Cranberry Deep Roaster Covered Baker Stoneware 3.1 Qt Dutch Oven ebay.io/m/fURxeE #eBay via@eBay#PamperedChef #SourdoughBread #dinner #Thanksgiving #KitchenEssentials #CasseroleDish #RoasterOven #OnePotMeals #HomeCooking #CranberryStoneware #Stoneware x.com/rusticrelics04/status/2118430901801750676/photo/1
Thanksgiving Grandpa of The Little Turkey T-Shirt. Amazon Prime delivery available➡️a.co/d/09k1gDIG 🍂🧡🤎💝#thanksgiving #grandpa #familyreunion #matching #Amazon via @Amazon
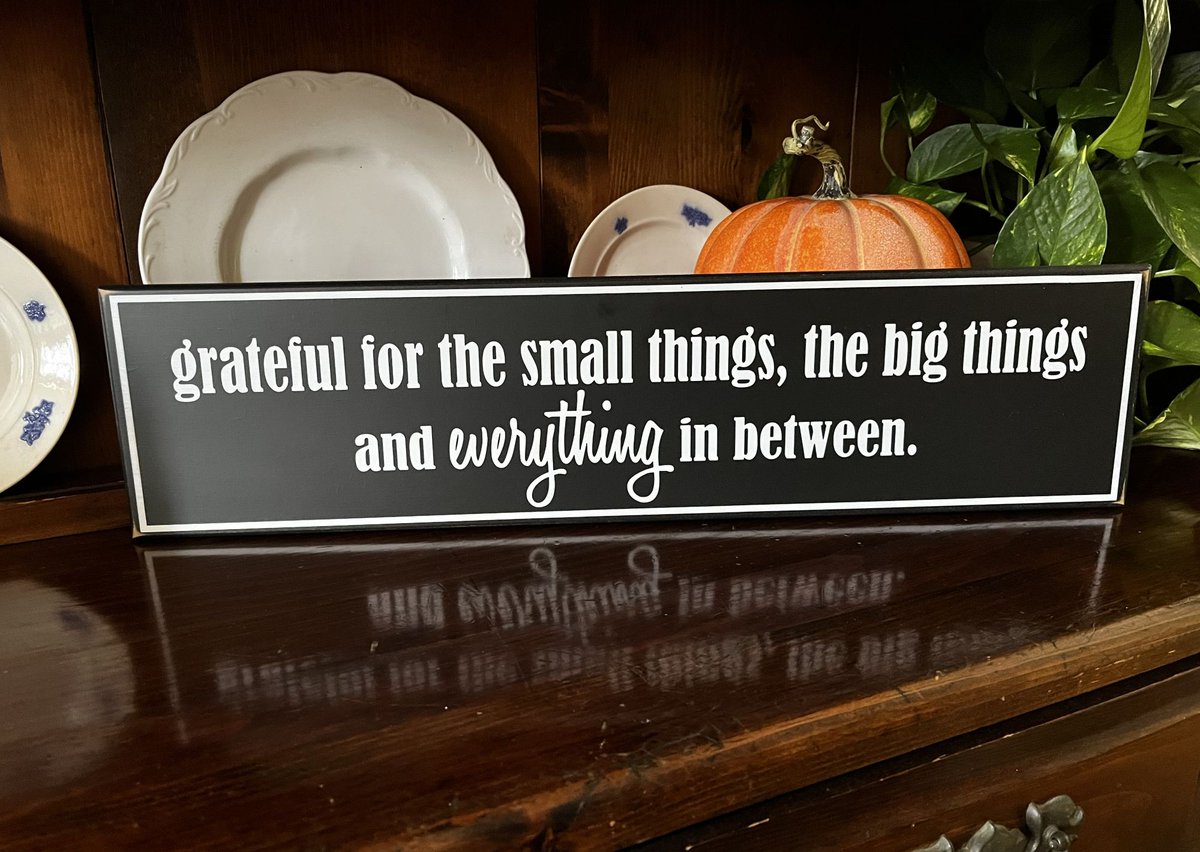
#thanksgiving Grateful for the Small Things the Big Things Wood Sign etsy.me/48H9okR via @Etsy #smilett23 x.com/CountryWorkshp/status/2119775010743320939/photo/1
🔥 X-RAY DISCOVERY! 🔥Nov 8 1895: Röntgen! ⚡• Rays: Named X• 1st Image: Hand & ring• Med Rev: Surgery 🏆📜 CA: CSsTw7awXqcLPrYJJmb7svKornGudLuBcWA8EV6tpump💬 TG: t.me/TaterNews1#XRays #Thanksgiving #Christmas #holiday #merrychristmas #holidaydecor #holiday x.com/TaterNews1/status/2119564567345008649/video/1
Cranberry shortcake is a beautiful dessert for the holidays #cranberries #cranberryshortcake #thanksgiving #dessert anationofmoms.com/2016/11/evites-pass-the-giving-html.html x.com/ANationOfMoms/status/2121298709304725733/photo/1

Gratitude can start before Thanksgiving dinner. Thank one quiet helper today and make appreciation a habit. Original fictional AI-generated seasonal story. #Thanksgiving #Gratitude x.com/CRYPTOFRIED_88/status/2121408674983751723/video/1
Turnpike Sports® Beatin’ The House™ - #Thanksgiving game #TripleWildThanksgiving at @CaesarsiCasino plus jackpots from @AriaLV @CacheCreekCR and @AL_Lottery@YouTube - youtu.be/o6PcfM68fsA - dts.podtrac.com/redirect.mp3/traffic.libsyn.com/turnpikesports/463BTHouse_AudioFinal.mp3#Bettortainment® from @GranaryWayMedia x.com/TurnpikeSports/status/2120898914337358286/photo/1

The Authors that carried the conversation, the top 10 by each figure.
Impressions. The Authors whose Posts X showed most often.
| Rank | Author | Impressions |
|---|---|---|
| 1 | Fear Queer Horror Guru✓@fearqueerhorror | 50,993 |
| 2 | Widemouth✓@Widemouthkaya | 22,989 |
| 3 | MGK✓@MGKorgi | 22,643 |
| 4 | OBSCURE✓@obscurezab | 14,783 |
| 5 | Kitchen Sanctuary✓@KitchenSanc2ary | 14,148 |
| 6 | Dre Dennis (NEW ACCOUNT)✓@ImDreDennis | 8,942 |
| 7 | Dear Writer@akama_kenneth | 7,884 |
| 8 | Horror N Haunted✓@HorrorNHaunted | 7,866 |
| 9 | Don Moen@donmoen | 7,776 |
| 10 | Old School 80s✓@OldSchool80s | 6,766 |
Engagement. The Authors whose Posts received the most engagement.
| Rank | Author | Engagement |
|---|---|---|
| 1 | Widemouth✓@Widemouthkaya | 1,026 |
| 2 | Nate✓@CristoTheRanger | 962 |
| 3 | MGK✓@MGKorgi | 663 |
| 4 | Horror N Haunted✓@HorrorNHaunted | 535 |
| 5 | Don Moen@donmoen | 522 |
| 6 | Tay Reed✓@thatdudereed_ | 492 |
| 7 | Wearlizer@Wearlizer | 440 |
| 8 | Hugo Gutiérrez✓@Hugo_Gutierrez_ | 425 |
| 9 | PETA UK✓@PETAUK | 317 |
| 10 | OBSCURE✓@obscurezab | 255 |
Activity. The Authors that published the most Posts.
Followers. The Authors with the largest audience.
| Rank | Author | Followers |
|---|---|---|
| 1 | Cult of Mac✓@cultofmac | 636,423 |
| 2 | Kenya Wildlife Service✓@KWSKenya | 535,855 |
| 3 | FarmVille 2@farmville2 | 456,929 |
| 4 | Imagen Radio✓@Imagen_Mx | 438,197 |
| 5 | News12LI@News12LI | 400,581 |
| 6 | Jesse Duplantis✓@jesse_duplantis | 366,096 |
| 7 | Quartz@qz | 331,868 |
| 8 | Don Moen@donmoen | 313,927 |
| 9 | Old School 80s✓@OldSchool80s | 304,305 |
| 10 | Animal Gourmet✓@animalgourmet | 272,175 |
Efficiency per account. The Authors with at least 2 Posts that earned the most impressions per Post.
| Rank | Author | Efficiency per account |
|---|---|---|
| 1 | Fear Queer Horror Guru✓@fearqueerhorror | 12,748 |
| 2 | MGK✓@MGKorgi | 11,322 |
| 3 | Dear Writer@akama_kenneth | 3,942 |
| 4 | Kitchen Sanctuary✓@KitchenSanc2ary | 2,830 |
| 5 | The Southern Lady Cooks✓@SouthLadyCooks | 2,163 |
| 6 | Zimmy's Nook@Zimmysnook | 1,311 |
| 7 | Krisna Hanks 😄✓@Square1Wellness | 1,213 |
| 8 | September 6th✓@6thTheGhost | 1,071 |
| 9 | Jesse Duplantis✓@jesse_duplantis | 1,062 |
| 10 | BlockChainBizz✓@BlockchainBizz | 984 |
How the Posts split by format and by origin, with the impressions and engagement of each part.
Original Posts, Replies and Quotes.
Share of Posts
Share of impressions
Share of engagement
A Post can be more than one type, so the shares can add up to more than 100 %.
Posts with an image against Posts without one.
| Category | Posts | Impressions | Engagement |
|---|---|---|---|
| With an image | 44.5% | 39.1% | 50.8% |
| Without an image | 55.5% | 60.9% | 49.2% |
Posts with a link against Posts without one.
| Category | Posts | Impressions | Engagement |
|---|---|---|---|
| With a link | 46.1% | 27.8% | 20.7% |
| Without a link | 53.9% | 72.2% | 79.3% |
Posts of verified Authors against Posts of the other Authors.
| Category | Posts | Impressions | Engagement |
|---|---|---|---|
| Not verified | 100.0% | 100.0% | 100.0% |
The language that X detected in each Post.
| Category | Posts | Impressions | Engagement |
|---|---|---|---|
| en | 90.0% | 92.1% | 90.9% |
| Undetermined | 6.7% | 3.2% | 2.9% |
| es | 1.7% | 2.4% | 3.7% |
| in | 0.23% | 0.67% | 0.97% |
| ja | 0.23% | 0.08% | 0.07% |
| tl | 0.23% | 0.05% | 0.09% |
| fr | 0.09% | 0.03% | 0.0% |
| it | 0.09% | 0.13% | 0.04% |
| de | 0.06% | 0.12% | 0.07% |
| Other | 0.60% | 1.2% | 1.3% |
The location that each Author declares on the profile.
| Category | Posts | Impressions | Engagement |
|---|---|---|---|
| Not stated | 30.2% | 33.7% | 39.3% |
| United States | 5.1% | 2.1% | 0.60% |
| USA | 1.4% | 2.6% | 0.77% |
| WORLD-WIDE | 1.3% | 0.80% | 0.03% |
| Worldwide | 1.1% | 0.17% | 0.11% |
| Texas | 1.1% | 0.19% | 0.21% |
| National Vegetable Protection | 0.91% | 0.16% | 0.06% |
| 3Fifteen In Camillus N.Y | 0.89% | 0.06% | 0.41% |
| Akron, OH | 0.86% | 0.52% | 0.31% |
| Other | 57.1% | 59.7% | 58.2% |
When the activity happened, hour by hour and day by day.
How many Posts were published in each period.
The impressions of the Posts published in each period.
The engagement of the Posts published in each period.
The hour of the day and the day of the week with the most Posts.
17:00Peak hour, UTC
FridayPeak day
The Posts of each hour of each day of the week, in UTC.
What the Posts named, linked and repeated.
The hashtags that the Posts used most.
The accounts that the Posts mentioned most.
The sites that the Posts linked to most.
The exact links that the Posts shared most.
The images of the Posts with the most likes and Reposts.
448 likes · 29 Reposts(opens the Post on X)251 likes · 52 Reposts(opens the Post on X)236 likes · 15 Reposts(opens the Post on X)235 likes · 37 Reposts(opens the Post on X)180 likes · 25 Reposts(opens the Post on X)157 likes · 141 Reposts(opens the Post on X)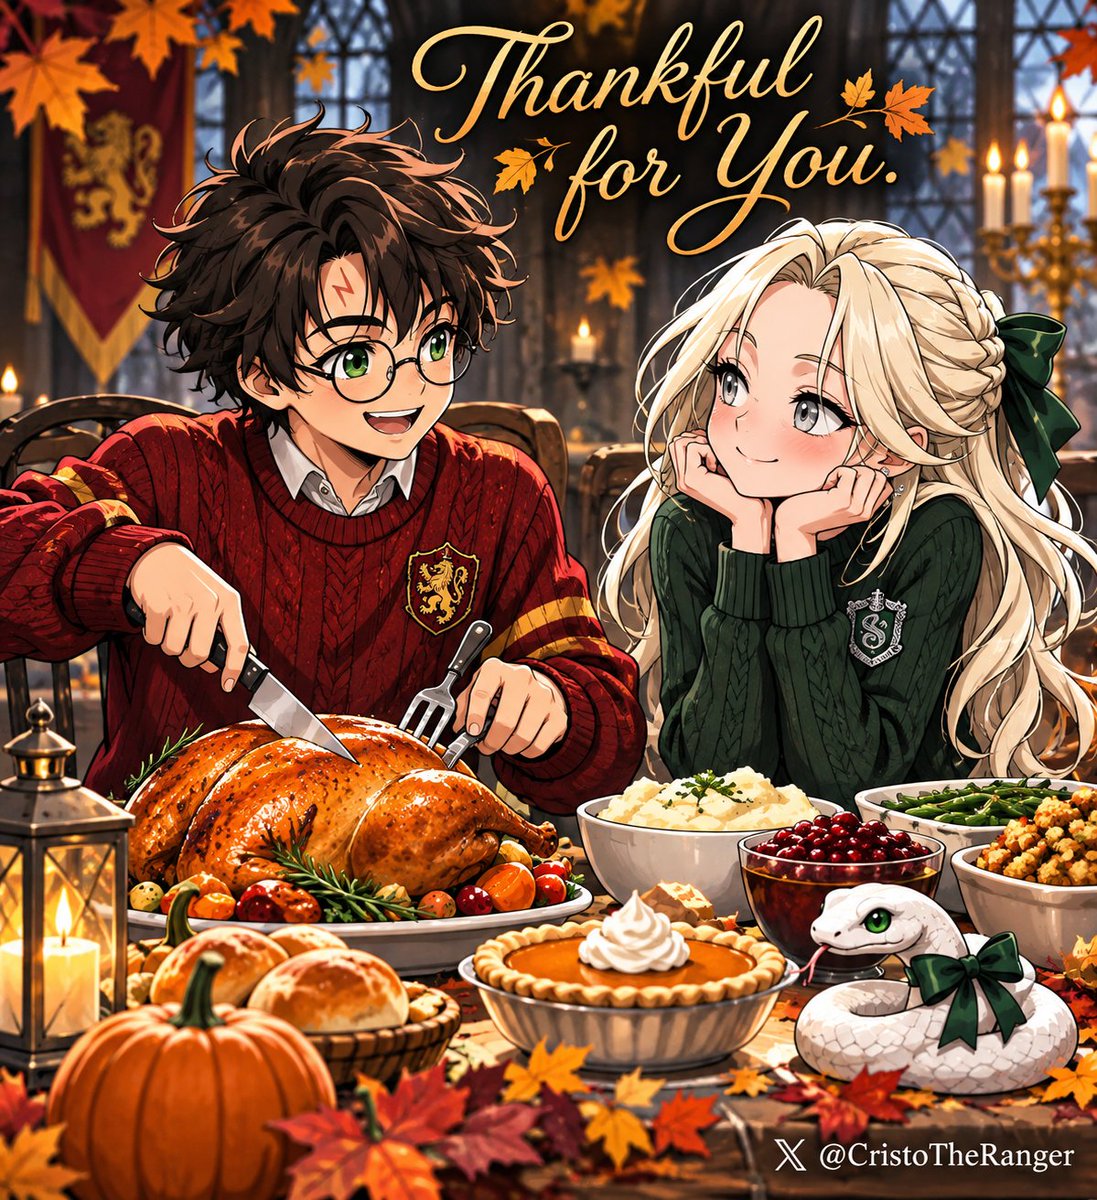 156 likes · 18 Reposts(opens the Post on X)
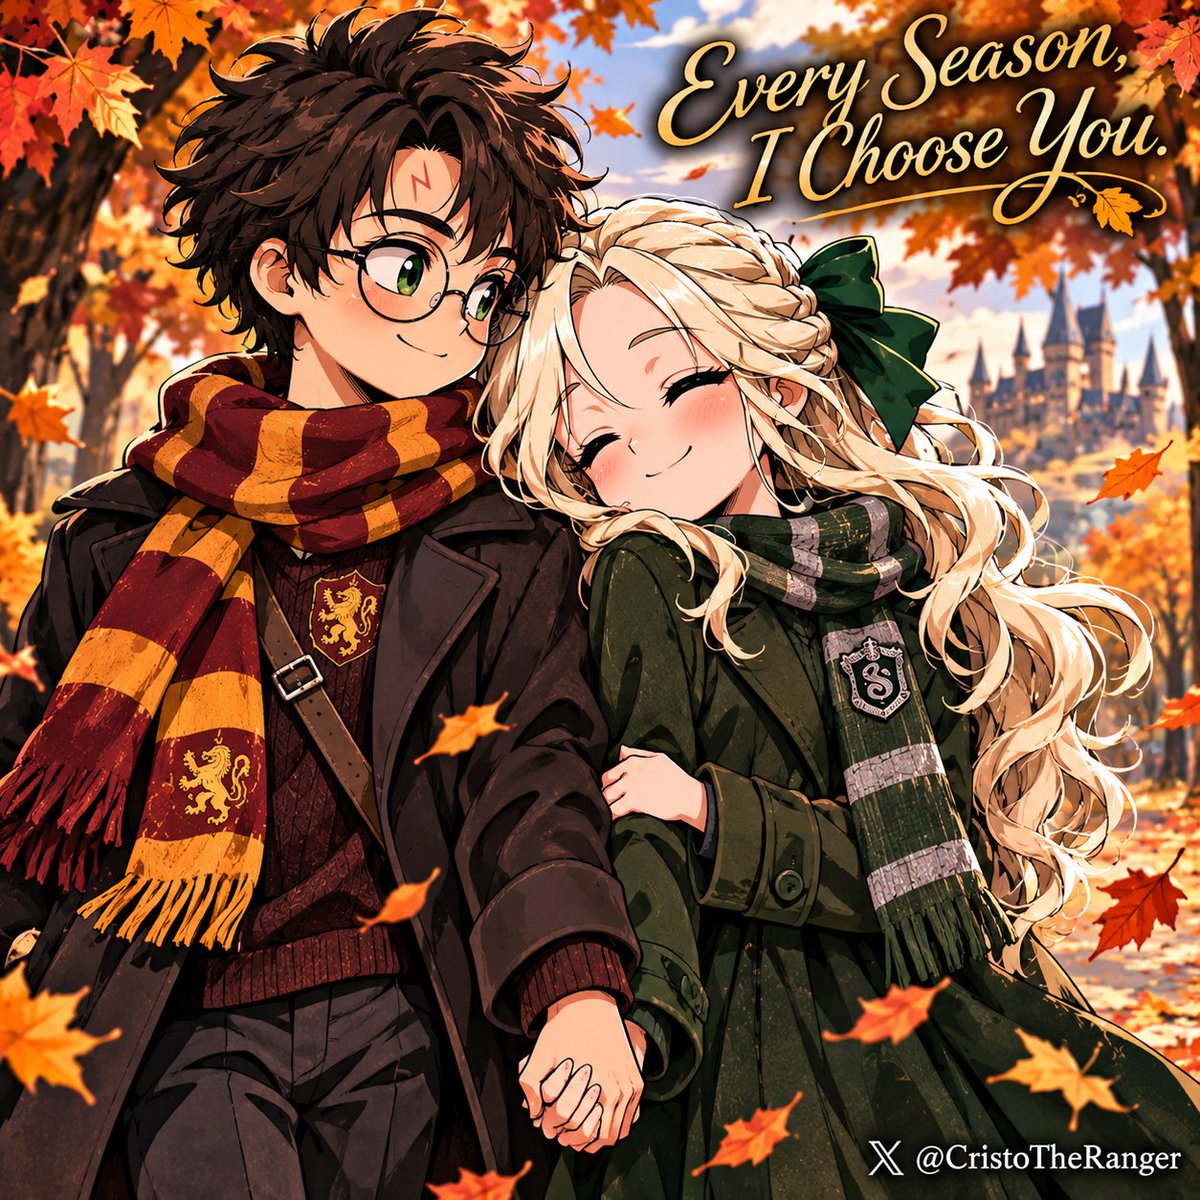 152 likes · 23 Reposts(opens the Post on X)
 143 likes · 3 Reposts(opens the Post on X)
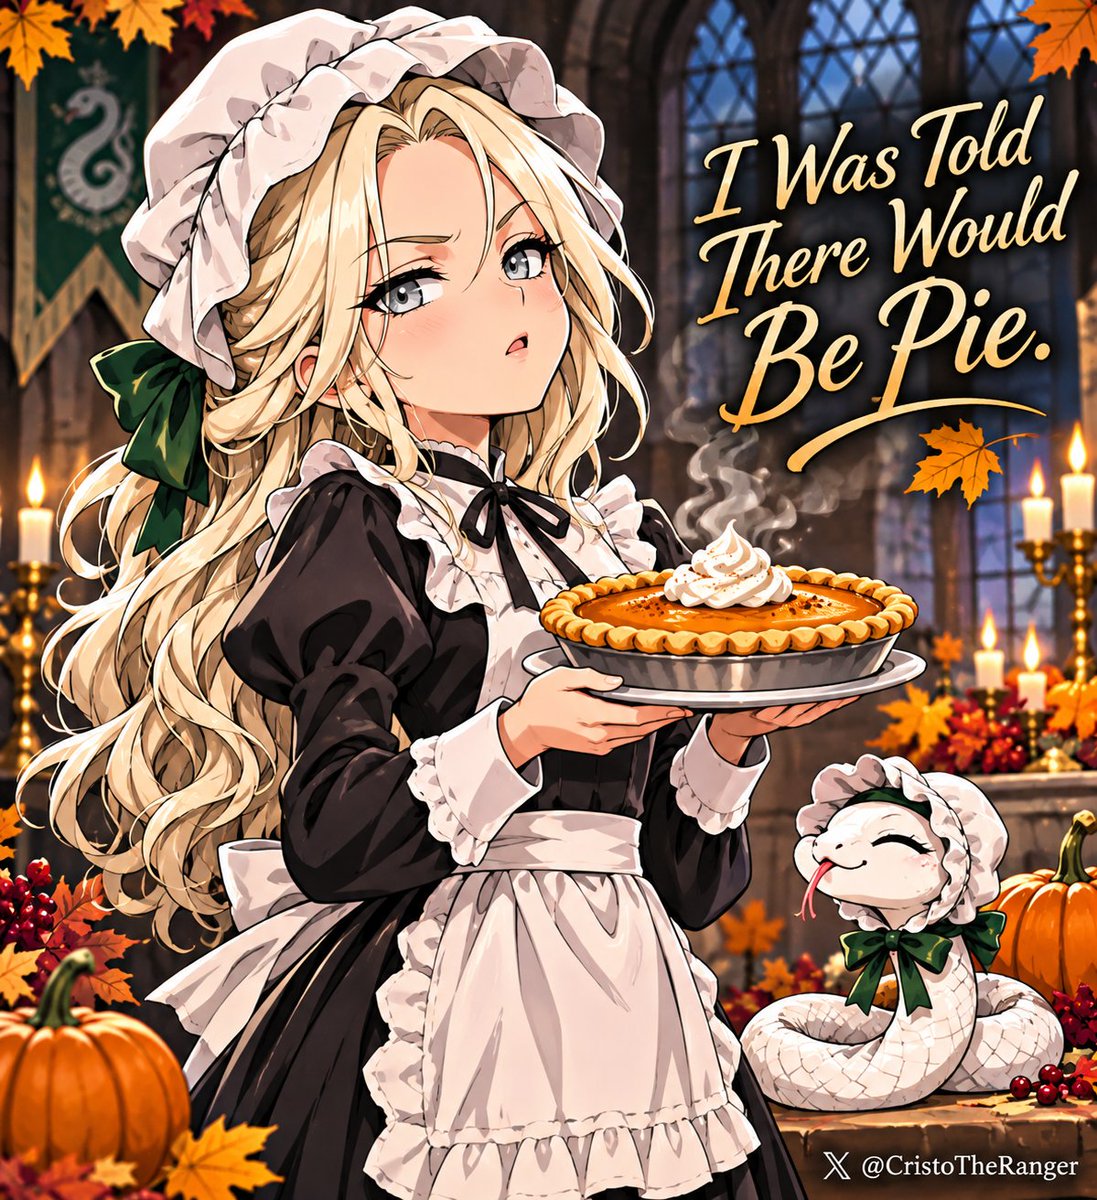 128 likes · 14 Reposts(opens the Post on X)
The emojis that the Posts used most.
The words that the Posts used most, without the common filler words.
Who took part, from the profile of each Author.


